Maps & GIS
in the browser
Atlas is how teams make maps and perform geospatial analysis together. Create, collaborate, share — all under one roof.
The Most Powerful GIS
Software in the Browser
Connected to your data. Delightful to share. Collaborate spatially without installing software.
For every planner,
make maps with ease
Build interactive maps that explains your data and encourage users to explore.
Analyze data
Understand your data in the context of location using intuitive analysis tools
Visualize trends
Create maps that uncover spatial patterns and trends
Foster collaboration
Facilitate teamwork and information sharing among GIS professionals, stakeholders and the community
Engage stakeholders
Present plans and proposals in an easily understandable and accessible format
Pricing
Free for non-enterprise customers!
We’re thrilled to announce that during our beta phase, Atlas is completely free for all non-enterprise users. Yes, you read that right—zero cost, unlimited possibilities!
Starter
Start creating maps and perform geospatial analysis with our free plan
Free
Forever
Features:
- Up to 3 projects
- Unlimited collaborators
- 500MB file storage
- Private & public projects
- Image & PDF exports
- Upload any geo format
- Geospatial analysis
- Embed maps
- Comments
ProfessionalBeta
For professionals that need to create maps and share them with clients
$39
per user / month
Everything in Starter, plus...
- Unlimited projects
- 10GB file storage
- Embed without logo
- Password-protected maps
- Professional exports
OrganizationBeta
For teams and organizations that need to collaborate on maps and data
$89
per user / month
Everything in Professional, plus...
- 50GB file storage
- Organization-wide datasets
- Embed without logo
- Professional PDF exports
- Version history (2024)
- API access (2024)
Enterprise
Manage the complexities of scaling geospatial databases and platform needs
Contact us
Tailored to your needs
Everything in Organization, plus...
- Unlimited file storage
- Training & onboarding
- Guest access controls
- Dedicated success manager
- Custom datasets
- Branded login page
- Early access to features
Agency Accounts
Are you an agency or service provider? Join our partner program to gain access to a free service partner account, exclusive features, and commission opportunities.
Frequently asked questions
We’re here to help with any questions you have about plans, pricing, and supported features.

What’s a workspace?
What kind of support does Atlas provide?
Can I share my maps publicly?
Do viewers of my maps need a separate plan?
Is there an Educational license?
Do you offer a non-profit discount?
We’ll help you get started
Browse the Blog and customer stories to find what you need to succeed with Atlas.
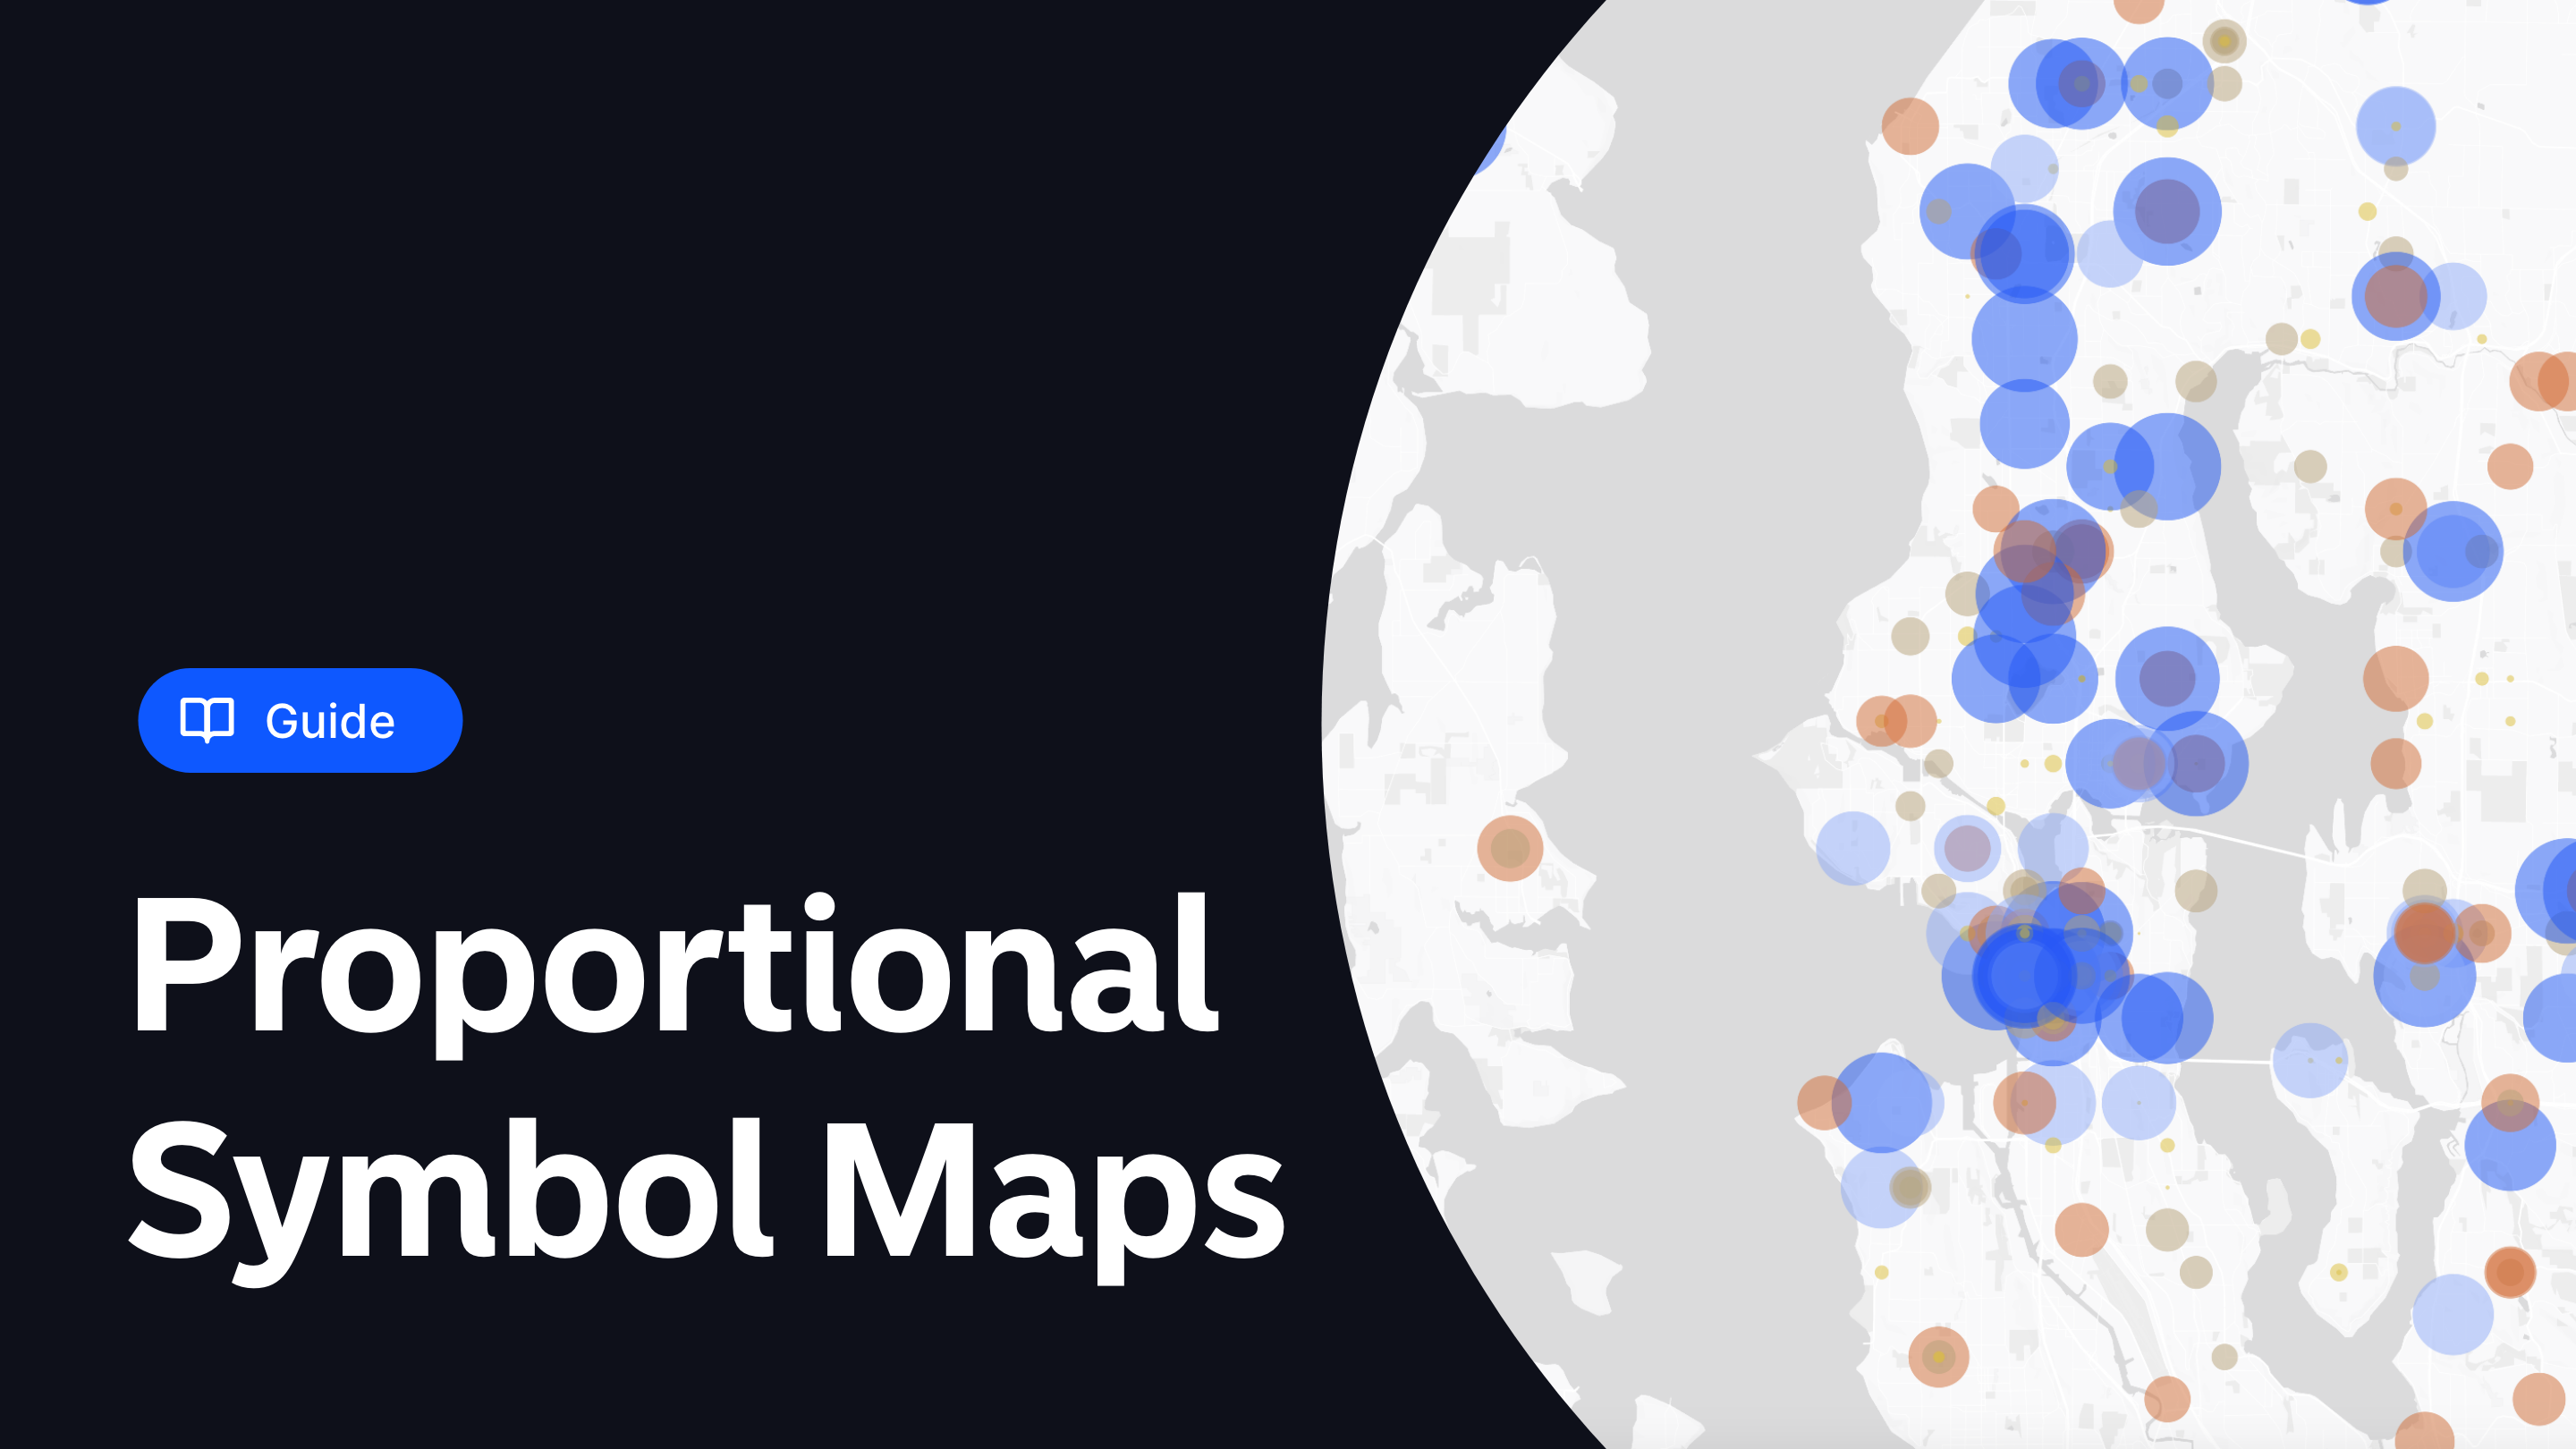
What is a Proportional Symbol Map?
Proportional Symbol Maps excel in this area by offering a blend of simplicity and depth. They transform raw data into engaging visuals, making it easier for both GIS professionals and stakeholders to understand spatial patterns and data distributions.

New in Atlas: Google Street View
We're excited to announce a new integration in Atlas: Google Street View! Whether you're a city planner, a developer, or simply a GIS enthusiast, this feature aims to enrich your projects with more contextual, real-world visuals.
![Travel Time Analysis [Complete Guide + 8 Examples]](https://www.atlas.co/images/posts/travel-time-analysis-hero.png)
Travel Time Analysis [Complete Guide + 8 Examples]
The Travel Time Analysis tool is used to compute the region accessible within a designated travel time or distance along a street network, depending on the chosen travel mode.